I’ve been steadily adding well locations to The Well Map, The Energy Harbinger’s current side project. The map currently has more than 600 well locations, half of which are in the North Dakota Bakken. Concerning the Rockies, I also have locations in Wyoming and Colorado and will eventually get into Utah and Montana. I added about 50 Chesapeake Eagle Ford wells today and plan to hit the Eagle Ford hard during the next several weeks. Eventually this map will allow for filtering by operator, well performance, etc to make it more usable, but for now you’ll have to check each well location individually.
I’ll try to put up some polls regarding companies/basins you would like me to add, but feel free to email me or respond to this post for now.
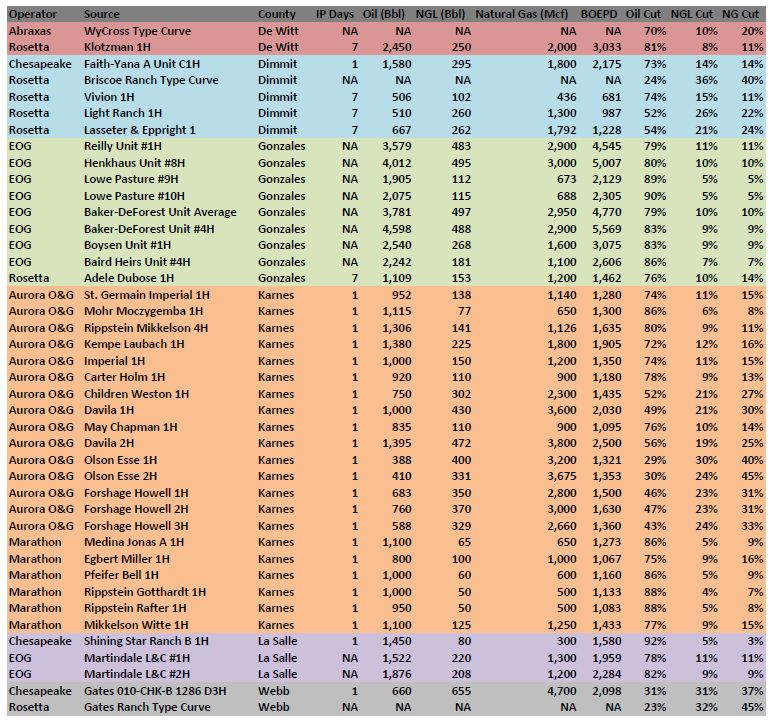
If you’ve been confused by any of the data in the dialogue box that pops up when you click on a well location, here’s an explanation: The box contains the following information: operator, well name, location, county, spud date, IP Days, BOPD, BNGLPD, Mcfpd and oil cut. The following is a definition for each category:
Operator: Owns a majority interest in the well and is in charge of drilling, completing and maintaining the well.
Well Name: Pretty self explanatory.
Location: Tells which Township-Range-Section a well is in. Texas doesn’t follow the T-R-S format, so for now I’ve been putting the “field name” as designated by the Texas Railroad Commission (TRC). I may eventually start using Texas’ land survey method, but for now you’re stuck with the field name.
County: Pretty self explanatory.
Spud Date: Date drilling commenced on well. Regarding Texas: The TRC doesn’t provide spud dates, so I’ve been substituting first month of production for spud date.
IP Days: Initial production days is the amount of days I used to compute the average production rates (BOPD, BNGLPD and Mcfpd). I am targeting a 30-day rate, but because of limited data provided by the state (they usually provide days a well produced in a given month), these rates fluctuate. The TRC only provides monthly production, so I assumed each well produced for 30 days during its peak month of production.
BOPD: Barrels of oil per day. This number is the average number of barrels produced during the IP Days. So if a well produced 600 BOPD and its IP days was 30, then on average the well produced 600 barrels of oil per day for 30 days. This number doesn’t necessarily represent the first 30 or so days the well produced oil, but the peak 30-day rate.
BNGLPD: Barrels of natural gas liquids per day. See BOPD description.
Mcfpd: Thousand cubic feet per day (of natural gas). See BOPD description.
Oil cut: Percentage of initial production that was oil.
Footnotes: *Certain wells have a * after the well name because the production rates I have computed may not reflect the actual rates of the well. This instance occurs in states like Texas where companies report production by lease. When several wells are drilled on a single lease, per well production can be difficult to determine. In certain cases I omitted the wells from the map, in others I inferred production rates based on the production profile of the lease and well completion dates. Efforts will be made to improve this data moving forward.