Category Archives: Oil and Gas Research

SandRidge’s Mississippian Wells are Improving

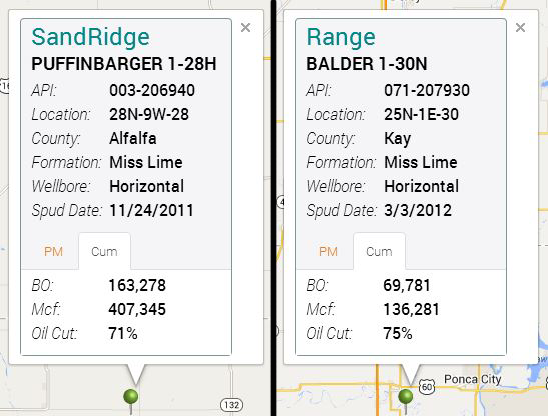
The Mississippian Lime has put companies and investors alike on a roller coaster ride during the last couple of years. When SandRidge Energy (SD) and Range Resources (RRC) started hitting big wells such as the Puffingbarger 1-28H and Balder 1-30N (see below), EUR and IRR projections ballooned to 600MBOE and more than 100%, respectively. Subsequent drilling has shown that these wells are more the exception than the rule, leading companies to slash their expectations considerably.

Big Wells in the Mississippian Lime
puffin-balder-misslime-well

Source: The Well Map.

The Lime’s inconsistency has led some companies to leave the play and some to dial back expectations, but there’s reason to believe companies are finally starting to figure out its eccentricities. SandRidge saw production results improve approximately 20% from 2011 to 2012. These results coupled with a decrease in wells costs have increased the economics of the play.

SandRidge began drilling in the Lime in late 2010, meaning their oldest wells have produced for about three years. The company is currently estimating that its wells pay out in two years, so we took a look at their oldest producers to see if those estimations are accurate.

The average well the company turned to production prior to 2012 has produced 26 MBO (thousand barrels of oil), 197 MMcf (million cubic feet of natural gas) and 4 MBNGL (thuosand barrels of natural gas liquids). Assuming $88 oil, $4 natural gas, $40 natural gas liquids and an NRI of 80%, these wells have grossed $2.5 million in two years.

Revenue by Hydrocarbon

Miss_Revenue-by-Hyrocarbon

Source: The Energy Harbinger / Oklahoma Tax Commission.

This data tells us that SD’s early wells didn’t pay out in two years based on a $3.2 million well cost. While that’s an important data point, investors should be more concerned with the results from the next thousand SD wells than the first 100. So let’s compare these results to what we’re seeing from the company’s newer wells.

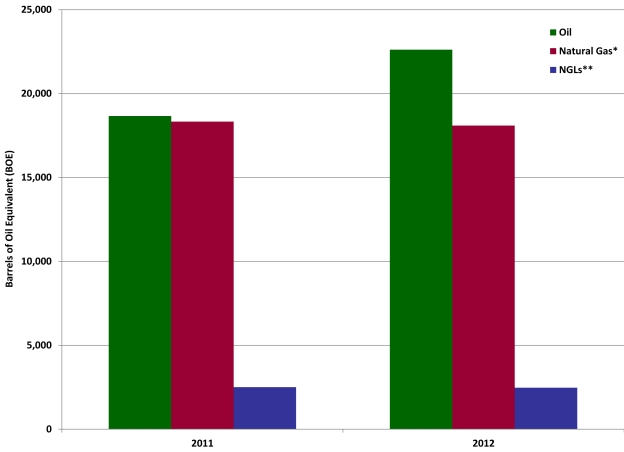
Average Production by Well During First Year (2011 to 2012)

miss-production-graph

Source: The Energy Harbinger / Oklahoma Tax Commission.
*Natural gas production converted to barrels based on 6:1 energy equivalency.
**Assumes 12% of natural gas stream is NGLs.

While natural gas production has remained flat, oil production by well increased approximately 20% from 2011 to 2012. This is important because oil is responsible for roughly 73% of a well’s revenue. If the 2012 wells continue to produce 20% higher than the 2011 wells, they’ll gross $3 million by their second year. SD is currently modeling sub $3 million well costs for the Lime wells, which means their newer wells are paying back in two years. A two year payback period is on par with most major oil plays in the United States.

At this point, we’re not sure why SandRidge’s newer wells are producing more oil. It could be that the company is able to focus on its better areas after it delineated it acreage or the new frac designs they’ve cited in their earnings transcripts are paying off. Either way, the production improvements make it a stock to watch for the future. To that end, Range is also tweaking its frac designs and has reported strong results in the few wells it has used to test the design.

If you track the Lime, you’ve probably heard of Petro River Oil (PTRC) who held its IPO earlier this year. The company has 85k net acres in the Mississippian and 32k net acres in a heavy oil play in Missouri. It recently attracted outside capital when Petrol Lakes (Chinese investment group) purchased $6.5 million in stock from Petro River. If you like micro-cap stories, these guys have an impressive management team which makes it a stock to watch.

The San Juan Basin: What You Need to Know

General Information
Why I should care: It’s a new horizontal play with some interesting production results.
Geographical location:  Northwest New Mexico.
Producing formations: Gallup, Mancos.
Main operators: Encana (ECA), WPX Energy (WPX).
Leasehold: ECA (176k net), WPX (31k net).
Average well cost: $4.5MM.
Average Royalty: 18%.

Average Peak Month Production by Formation
Gallup (27 wells): 275 BOPD and 406 Mcfpd (81% Oil).
Mancos (9 wells): 194 BOPD and 265 Mcfpd (71% Oil).

Source: www.thewellmap.com / New Mexico Oil Conservation Division.

Average Peak Month Production by Operator
ECA (27 wells): 215 BOPD and 409 Mcfpd (74% Oil).
WPX (6 wells): 391 BOPD and 318 Mcfpd (87% Oil).

Source: www.thewellmap.com / New Mexico Oil Conservation Division.

Average Peak Month Production by County
Rio Arriba (3 wells): 173 BOPD and 332 Mcfpd (56% Oil).
Sandoval (14 wells): 354 BOPD and 545 Mcfpd (79% Oil).
San Juan (16 wells): 175 BOPD and 271 Mcfpd (79% Oil).

Source: www.thewellmap.com / New Mexico Oil Conservation Division.

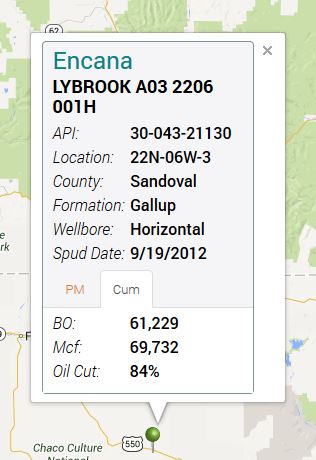
Largest Well by Cumulative Production
San-Juan-Basin_Biggest-Well

Source: www.thewellmap.com.

Smallest Well by Cumulative Production
San-Juan-Basin_Smallest-Well

Source: www.thewellmap.com.

Economics
Assuming $90 oil, $3.50 gas, 80% NRI and $4.5 well cost, a company needs to recover approximately 60 MBO (thousand barrels of oil) and 65 MMcf (million cubic feet of natural gas) to break even. Of the 10 wells that have been producing in the play for two years or longer, 3 have broken even. These three wells had peak production rates ranging from 275 BOPD and 718 Mcfpd to 535 BOPD and 854 Mcfpd. These ranges give us some parameters which will alow us to judge the ecoomics of new wells coming on.

The average peak month rates for wells spudded in 2013 are 329 BOPD and 400 Mcfpd, numbers that are similar to our early wells that have broken even. While it’s very early in this play, I think there’s reason to believe the average San Juan Basin well will pay back in two to three years which makes it competitive with current major plays from an economics standpoint. Will it be as big? Highly doubtful, but it could provide a nice production/earnings bump for the play’s early entrants.

Can Iroquois Fix Gale Force Petroleum?

Last week, Texas oil producer Gale Force Petroleum (GFP) received its second letter this year from one of its top shareholders, New York based Iroquois Capital Opportunity Fund (ICO Fund). The letter was ICO Fund’s second request for GFP to shake-up its Board of Directors who, according to ICO, have caused “severe mismanagement of Gale Force’s otherwise valuable assets.” GFP’s share price, which closed at $0.14 on October 1, has been in a tail-spin since peaking at $0.38 in March 2012. The 63% price slide (see graph below) reflects decreased production due to poor well results and a lack of overall direction for the company.

If you’re not familiar with Gale Force, their assets include its Texas Reef prospect which consists of 4,300 acres in Anderson and Henderson Counties in East Texas, 4,101 acres in Wood County (East Texas) and 795 acres in Bee County (South Texas). They also own 10,000 non-operated acres in the Marcellus which serves as a nice cash flow piece. The Texas Reef asset was acquired in April 2012 for $4.6MM and is considered the company’s primary asset. To help finance the purchase and development of Texas Reef, GFP sold its interest in certain Oklahoma properties for $6.5MM in March, 2013. These assets produced at an average rate of approximately 121 BOEPD (40% oil) at the time of the sale.

Predictably, the sale of the Oklahoma properties caused the company’s average production to decline to160 BOEPD during the quarter ended June 30, 2013, 42% lower than the 277 BOEPD the company averaged during the same quarter in 2012. This production decline was expected to be offset by production increases from the Texas Reef play and its other assets which GFP predicted would “triple production year-over-year in 2012.” Unfortunately, completion mistakes caused its first two Texas Reef wells to produce from a water zone.

These results combined with significant hedging losses have left the company with $5.5MM in debt due in July, 2014, $706M in cash on its balance sheet and trailing 9-months operating cash flow of -$1.3MM. To make matters worse, one of its primary shareholders, Iroquois Capital, doesn’t believe management is capable of turning the ship around.

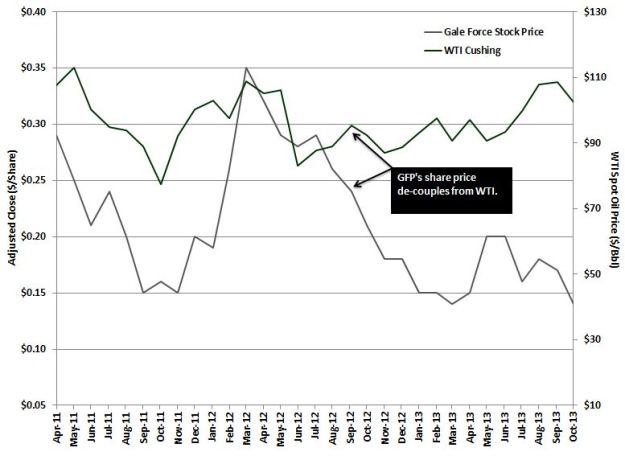
Gale Force’s Stock Price (April 2011 – October 2013)

gale force_stock price chart

Source: Yahoo Finance / The Energy Harbinger.

If Iroquois’ assertion that Gale Force’s stock price slide has more to do with “lack of effective oversight by the board,” than resource quality, the graph above shows that the market might agree. From April, 2011 to June, 2012, the oil weighted company’s stock tracked WTI before decoupling in the latter half of 2012. When an oil company decouples from WTI to this degree, either the asset base has deteriorated or the company is experiencing financial/operational troubles.

It would be difficult to argue the former as GFP’s asset base has certainly gotten oilier after the divestiture of the Gregg and Rusk County assets in Oklahoma. Production from these assets was approximately 40% natural gas and its sale raised $6.5MM which was used to pay down debt. Now the company is sitting on 2 million barrels of oil equivalent (MMBOE) (68% oil) in East Texas and the market is valuing the assets at $9.76 per barrel. This valuation is low when one considers the assets are in an established oil field and only 24% of the reserve basis is producing.

Just how undervalued is GFP?

peer comps

Source: Financial Statements / The Energy Harbinger.

If we look at a micro-cap peer group made up of companies with conventional assets in mature basins, we get an average EV/Reserves multiple of $13.86, meaning on average companies with assets similar to Gale Force’s are valued approximately 44% higher. If we use the peer set multiple on GFP’s reserves of 2.1MMBOE, we receive an implied enterprise value of $29.26MM. If we then subtract net debt/preferred stock we receive an equity value of $18.64MM which we divide by the company’s 65MM shares outstanding to get an implied price per share of $0.29.

The company is undervalued, despite having valuable assets, because it has no financial plan to develop the assets. This is where a company with ICO Fund’s track record can step in and restore confidence to GFP’s shareholders. The company has several other micro-cap oil and gas companies in its portfolio, including AusTex (AOK) and PetroRiver (PTRC), proving that it has ample experience in the industry.

In addition, ICO Fund was instrumental in turning around Long Range Acoustic Device (LRAD) by replacing several board members and renegotiating options held by executives with very favorable strike prices. LRAD’s stock price is now up 51% since May, a tribute to Iroquois’ ability to put the correct people in place on the board and re-incentivize management. If Iroquois is able to reach a similar agreement with Gale Force, I believe it would restore confidence and value to a company that’s in obvious need of direction.

If your plan is to buy low on GFP, you might want to expedite that plan as the record date for its general meeting is October 9. The actual meeting is on November 21, so if you want to support Iroquois, who hired Kingsdale as its proxy, act fast.

GeoSouthern’s Production and Proppant Use are Down in the Eagle Ford

GeoSouthern (private) is one of the companies that pioneered the development of the Eagle Ford Shale. Its primary acreage is in De Witt County’s Black Hawk field (see map below) which is an Eagle Ford sweet spot. To date, the company has drilled and completed (D&C) more than 100 wells in the formation which have produced more than 15 million barrels of oil (MMBO) and 98 billion cubic feet of natural gas (Bcf). That’s $1.7 billion worth of hydrocarbons at $90 oil and $4 natural gas.

Note: Petrohawk’s type curve for the Blawk Hawk field has the following hydrocarbon breakdown: 51% oil, 28% natural gas and 21% natural gas liquids (NGLs). The economic analysis in this piece was conducted using data provided by the Texas Railroad Commission which does not break-out NGLs and shows approximately 50% of the production from GeoSouthern’s wells is oil. To be on the conservative side, I didn’t account for NGLs but know they represent upside to the natural gas price.

GeoSouthern’s De Witt County Wells
GeoSouthern_The-Well-MapSource: The Well Map / The Energy Harbinger.

While GeoSouthern has produced a lot of hydrocarbons from De Witt County, the formation is deep with depths ranging from 12k’ to 14k’ and total depths from 16k’ to 20k’ feet meaning some wells are nearly four miles long. Needless to say, they aren’t cheap to drill and the early wells drilled in this field probably cost in the neighborhood of $10 million.

A well that wouldn’t fall into the $10 million category is Geo’s first well drilled in the Eagle Ford, Migura 1. This well was completed on April 22, 2009 with a 2,780′ lateral and frac’d with 626 thousand pounds of proppant, a very small frac compared to the standards the company would employ shortly thereafter. The well has produced roughly 19k BO and 126 MMcf to date, making it far and away the smallest well the company has completed to date.

Geo D&C 64 wells in De Witt County prior to 2012. These wells were (on average) completed with 4,840′ laterals and 4.5 million pounds of proppant, meaning the company didn’t waste much time ramping up its frac cocktails. These wells have produced an average of 182k barrels of oil (BO) and 1.1 billion cubic feet of natural gas (Bcf). If we assume a price deck of $90 oil and $4 natural gas, they’ve grossed an estimated $20.8 million a piece to date.

Post 2012, Geo has D&C 39 wells which haven’t performed as well as the earlier wells. Peak month oil production is down 38% and these wells produced at a rate of 218 BOPD during their first year, 34% less than the 332 BOPD rate the pre-2012 wells produced at.

While It’s possible the company drilled its best areas first, it’s worth noting the post 2012 wells used an average of 3.8 million pounds of proppant, 14% less than the 4.5 million pounds the earlier wells used. Laterals also decreased 8% to an average of 4,433′ per well from 4,840′ per well. While this undoubtedly decreased well costs, the graph below shows proppant use has a significant impact on production.

Oil Production and Proppant Used per Well
geosouthern_proppant-scatter-plot
Source: Texas Railroad Commission / The Energy Harbinger.

The scatterplot above contains completion data from 82 wells D&C by GeoSouthern in De Witt County. The data shows pounds of proppant used in a well can explain approximately 36% of the variation in its production during the first year. Knowing this, it’s reasonable to assume at least some of the company’s decrease in production can be attributed to a change in completion designs.

Admittedly, bigger isn’t always better. Companies should aim to produce the most economic wells and if that can be accomplished by using lower amounts of proppant, then it’s a good move by the company. I would warn that production  from the later wells fell off 34% during year-one, implying costs would have to fall by a similar proportion for the move to make sense. I highly doubt Geo’s well costs have fallen by $3.4 million during that time frame as companies are reporting costs North of $8.0 million in that area.

The Well Map Beta Testers: We apologize for the delay in the beta but we plan on sending out emails with login credentials for the test early next week. We want the beta to be the best experience possible so we decided to postpone testing until the site was running to our expectations.

-The Well Map Team.

Chesapeake’s Monster Hogshooter Well

A couple months ago I wrote a piece on the biggest wells by formation and I just came across one that should have been in that group. Chesapeake’s (CHK) Thurman Horn SL #406H well, located in Wheeler County, TX, produced at a whopping 6,829 BOEPD during its peak production month. While you might be inclined to think natural gas accounted for much of the production given the area, CHK broke out the hydrocarbon production for the first 8-days as follows, 74% oil, 16% natural gas liquids (NGLs) and 10% natural gas.

Well Name: Thurman Horn SL #406H
Operator: Chesapeake
County, State: Wheeler, TX
Formation: Upper Hogshooter/Missourian Wash (9,915′)
Spud Date: May 1, 2012
Peak Month Rate Oil: 4,801 BOPD
Peak Month Rate Gas: 12,172 Mcfpd
Cumulative Oil: 497,635 BO
Cumulative Gas: 2,112,139 Mcf
Latest Monthly Rate Oil: 249 BOPD
Latest Monthly Rate Gas: 2,395 Mcfpd
Source: Texas Railroad Commission/The Energy Harbinger.

While this is a monster well and might even be responsible for the largest 30-day rate of any horizontal well ever drilled on land, there’s a few things that need to be kept in mind. First, this well is not indicative of other wells drilled in the Texas Panhandle Wash play. Most of the wells drilled in this area are much gassier and produce far less oil. In fact, even as prolific as the oil production has been in this Thurman well, it only accounted for 30% of production during its last monthly rate (compared to 70% during its peak month) which shows us that the oil decline in these wells is very high.

What this well does show us is how prolific the Hogshooter (Missourian Wash) formation can be. CHK and Forest Oil (FST) have both drilled a number of Hogshooter wells that have produced impressive amounts of hydrocarbons. If you aren’t familiar with this zone, a comparison could probably be made to the Lodgepole in North Dakota: A prolific zone in a formation that only exists in certain areas and is very difficult to target. Chesapeake itself has approximately 30k net acres it considers prospective for the Hogshooter zone.

Verticals could be Key to Mississippi Lime Development

Most people probably associate the present and future of the oil and gas industry with horizontal wells and monster frack jobs in deep formations. That concept is driven by the idea that most of the shallow oil that’s easy to get to has been exploited, leaving deep plays in tight rock as oil’s last frontier. I’d respond to that argument with Lee Corso’s famous line, “not so fast my friend.”

The industry’s technological advances haven’t just improved horizontal drilling, they’ve improved vertical drilling as well. For instance, it’s now possible to drill a vertical well into a targeted zone and fracture the rock similar to a horizontal. This is an effective way to delineate acreage in formations that are characterized by multiple producing strata with “trapped” hydrocarbons like the Mississippian Lime, versus a resource play like the Bakken.

To illustrate this, SandRidge’s (SD) well results on the Western side of the Mississippian are all over the board. They’ve drilled wells like the Puffinbarger 2-28H which produced 51 thousand barrels of oil (MBO) in its peak month alongside a plethora of wells which never topped 1 MBO in a month. Out East it’s a similar story with Range (RRC) whose landmark Balder well produced 19 MBO in its peak month, but it has also drilled a number of wells which won’t top 19 MBO in their first year of production. The results are indicative of a play with high concentrations of oil in small areas “trapped” by faults, synclines, etc. versus widespread oil across a large area.

These companies will tell you it’s a numbers game and the good wells more than make up for the bad ones. Even if this is true and companies are earning an acceptable IRR from their drilling program, is it really the best use of investor capital to be drilling a large number of expensive, uneconomic wells or is there a better way?

Austex (AOK) is a company that’s taking a different approach to the Lime. While the big companies are using data from the Lime’s old vertical wells to “delineate” acreage (the formation has a lot of historical production), it’s drilling new vertical wells with new technology to find oil. Once a high producing area is found, clusters of verticals can be drilled at 20 to 40 acre spacing. It’s early on, but the results of the program (see below) are looking solid.

Austex’ Vertical Well Results
Austex_Results
Source: The Energy Harbinger / Oklahoma Corporation Commission.
1Production results during first six-months of well.
2Natural gas production isn’t publicly available. This number was calculated based on assumption of a 30% natural gas cut during the first 6-months of production.
3Cost per barrel calculated as estimated well cost divided by first six months of production.
4Estimated revenue generated from well during first 6-months of production. Assumed 85$ oil, $3 natural gas and 80% NRI.
5Cletus 20-5, Blubaugh 20-4 and Blubaugh 20-1 all share tank batteries with a second well making actual production from the individual wells difficult to determine. The production numbers shown are averages.

The above table shows Austex’ vertical wells aren’t only consistent but they’re also nearly paying for themselves in six-months. These wells were all drilled in Township 25 North, Range 1 East, Section 20, so it’s obviously a strong section for the company and may not be indicative of results across the play. Austex is a small company and doesn’t have the capital to drill a large number of wells at this point, but it will be interesting to measure consistency on the wells as the program develops. The company has 5,500 acres in this area, known as its Snake River Project, and plans to develop it at 40-acre spacing.

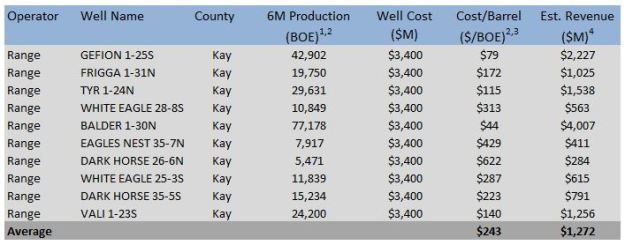
When we contrast Austex’ results with those of Range’s horizontal program in the same area, we see they lack the consistency of the verticals.

Range’s Horizontal Well Results
Range_Results
Source: The Energy Harbinger / Oklahoma Corporation Commission.
1Production results during first six-months of production.
2Natural gas production isn’t publicly available. This number was calculated based on assumption of a 30% natural gas cut during the first 6-months of production.
3Cost per barrel calculated as estimated well cost divided by first six months of production.
4Estimated revenue generated from well during first 6-months of production. Assumed 85$ oil, $3 natural gas and 80% NRI.

Range’s horizontal program boasts results which include the Balder 1-30N which is a best in class well (vertical or horizontal) and the Dark Horse 26-6N which might never recover its original cost. The company is probably drilling these wells to hold its Mississippian leasehold which consists of 160k net acres, so it’s not necessarily targeting its best acreage. With that said, why not drill more verticals whose cost per barrel of $61 per BOE (see footnotes above) is much less than the $243 per BOE it’s paying for horizontals?

PetroRiver Oil (PTRC) is a micro-cap E&P whose acreage, located along the Nemaha Ridge in Southeast Kansas, is in the same geological area as Austex. The company’s team is made up of some of the key engineers and executives who designed Austex’ vertical program. Due to Austex’ success, it’s likely they’ll take a similar approach. Petro is definitely a company to keep an eye on in the Lime as they’re well positioned in a play with a lot of upside.

The Mississippian has gotten some bad press from companies like SandRidge and Range, as both have pumped the markets on the play’s economics and probably taken the wrong approach to development. While it’s not prudent to make decisions based on a few solid well results, I believe the geological characteristics of the Lime make vertical wells (at least initially), the best method to develop the play.

Largest Oil and Gas Wells by Formation

Note: Added Powder River Basin well on June 10, 2013

I don’t usually talk about “largest wells” in formations or plays because they aren’t representative of the productivity or economics of a play as a whole. With that said, it’s still good to know where the biggest wells are being drilled because that usually indicates there’s a lot of oil in the area (whether it can be extracted consistently and economically is another matter).

Note: Peak month rate oil/gas is the amount produced in a given month divided by 30 days.

Well Name: Behr 11-34
Operator: Whiting (WLL)
County, State: Mountrail, ND
Formation: Bakken
Spud Date: April 15, 2008
Peak Month Rate Oil: 1,492 BOPD
Peak Month Rate Gas: 1,008 Mcfpd
Cumulative Oil: 911,627 BO
Cumulative Gas: 558,996 Mcf
Latest Monthly Rate Oil: 273 BOPD
Latest Monthly Rate Gas: 242 Mcfpd
Source: North Dakota Oil & Gas Commission/The Energy Harbinger.

Well Name: Jendrusch Unit 1H
Operator: Plains Exploration and Production (PXP)
County, State: Karnes, TX
Formation: Eagle Ford
Spud Date: April 21, 2012
Peak Month Rate Oil: 2,551 BOPD
Peak Month Rate Gas: 3,917 Mcfpd
Cumulative Oil: 341,352 BO
Cumulative Gas: 629,981 Mcf
Latest Monthly Rate Oil: 681 BOPD
Latest Monthly Rate Gas: 1,825 Mcfpd
Source: Texas Railroad Commission/The Energy Harbinger.

Well Name: Frye Ranch 2012H
Operator: Forest Oil (FST)
County, State: Wheeler, TX
Formation: Granite Wash/Hogshooter
Spud Date: March 23, 2010
Peak Month Rate Oil: 2,149 BOPD
Peak Month Rate Gas: 20,630 Mcfpd
Cumulative Oil: 327,782 BO
Cumulative Gas: 6,081,260 Mcf
Latest Monthly Rate Oil: 70 BOPD
Latest Monthly Rate Gas: 1,444 Mcfpd
Source: Texas Railroad Commission/The Energy Harbinger.

Well Name: Livestock 1-25H
Operator: SandRidge Energy (SD)
County, State: Grant, OK
Formation: Mississippian Lime
Spud Date: March 18, 2012
Peak Month Rate Oil: 1,595 BOPD
Peak Month Rate Gas: 3,909 Mcfpd*
Cumulative Oil: 170,398 BO
Cumulative Gas: NA
Latest Monthly Rate Oil: 214 BOPD
Latest Monthly Rate Gas: NA
Source: Oklahoma County Commission/The Energy Harbinger.
*Natural gas data is not publicly available for this well. Rate was computed using IP rates in the completion report.

Well Name: Dolph 27-1HZX
Operator: Anadarko Petroleum (APC)
County, State: Weld, CO
Formation: Niobrara
Spud Date: January 9, 2011
Peak Month Rate Oil: 730 BOPD
Peak Month Rate Gas: 1,595 Mcfpd
Cumulative Oil: 154,287 BO
Cumulative Gas: 568,554 Mcf
Latest Monthly Rate Oil: 71 BOPD
Latest Monthly Rate Gas: 331 Mcfpd
Source: Colorado Oil and Gas Commission/The Energy Harbinger.

Well Name: Anderson 18H-1
Operator: Encana (ECA)
County, State: Amite, MS
Formation: Tuscaloosa Marine Shale
Spud Date: January 15, 2012
Peak Month Rate Oil: 840 BOPD
Peak Month Rate Gas: 267 Mcfpd
Cumulative Oil: 115,991 BO
Cumulative Gas: 35,075 Mcf
Latest Monthly Rate Oil: 169 BOPD
Latest Monthly Rate Gas: 54 Mcfpd
Source: Mississippi Oil & Gas Board/The Energy Harbinger.

Well Name: Federal 16-10/3FH
Operator: Helis (Private)
County, State: Converse, WY
Formation: Frontier
Spud Date: July 16, 2011
Peak Month Rate Oil: 1,198 BOPD
Peak Month Rate Gas: 1,461 Mcfpd
Cumulative Oil: 270,530 BO
Cumulative Gas: 272,705 Mcf
Latest Monthly Rate Oil: 281 BOPD
Latest Monthly Rate Gas: 258 Mcfpd
Source: Wyoming Oil and Gas Conservation Commission/The Energy Harbinger.

For those of you who use the prototype version of the The Well Map, this is the type of data you’ll be able to access using the full version which will launch this summer.

Disclaimer: These are the largest wells in the above formation that I’m aware of. If you know of larger ones, feel free to disclose.

Macro U.S. Oil Data (2002/2012) + Energy Independence Musings

I felt it was time to get some macro data on this site which provides perspective for some of the “hot-button” words heard in the news media like “energy independence.” The data below compares oil and petroleum product imports during 2002 and a decade later during 2012. The U.S. imported 3.9 billion barrels of oil* (BBO) (10.6 MMBOPD) during 2012 or 8% less than the 4.2 BBO (11.5 MMBOPD) it imported in 2002.

We also used less oil in 2012 as consumption dropped 6% to 6.8 BBO (18.5 MMBOPD) compared to 7.2 BBO (19.8 MMBOPD) in 2002. Imports as a percent of total consumption have dropped from 58% in 2002 to 57% in 2012, meaning we’re not importing significantly less petroleum contrary to what many would hope as domestic production increases.
*When I refer to oil in the above paragraph, the figure includes petroleum products (see below for definition).

Let’s answer the next natural question here, how much did domestic oil production really increased during the decade in consideration? In this section we’re going to look at just crude oil which would be distinct from petroleum products.

U.S. Crude Oil Production (2002 to 2012)
U.S.-domestic-crude-oil-production_2002-2012
Source: EIA.

Domestic crude oil production increased 14% to 2.4 BBO (6.5 MMBOPD) in 2012 from 2.1 BBO (5.7 MMBOPD) in 2002. This of course doesn’t tell the full story as crude production was tanking circa 2008 before shale production ramped up and changed the course of our energy history. I’d have to imagine there would be a lot more support for the Keystone XL pipeline if U.S. oil shale hadn’t been exploited.

If you’re wondering about exports, we shipped approximately 22 MMBO (60 MBOPD) across borders during 2012, 564% more than 3.3 MMBO (9 MBOPD) in 2002 and 49% less than 43 MMBO (118 MBOPD) in 1999. While exports increased quite a bit over the time studied, 22 MMBO is a spit in the proverbial bucket.

All in all, it doesn’t seem like we’re a whole lot closer to energy independence than we we’re during 2002 as even domestic production hasn’t increased that drastically when you look at the period as a whole. With that said, when most people think about energy independence, they’re probably throwing Canada into the mix which makes the concept slightly more feasible while also putting our energy fate in the hands of heavy crude, a dirty proposition.

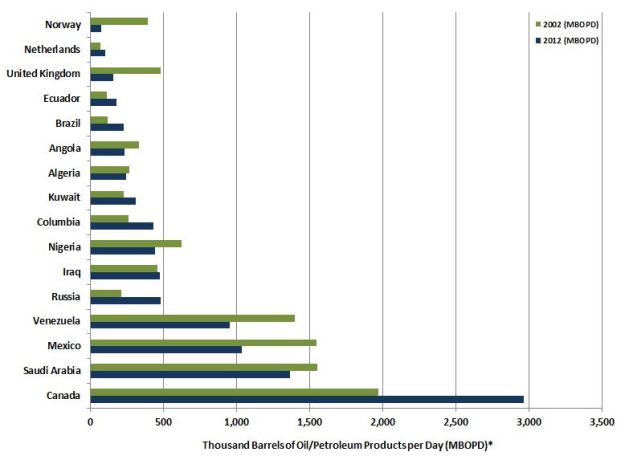
U.S. Imports of Oil and Petroleum Products by Country (2002 and 2012)
US-Oil -Import Data_2002-2012
Source: EIA
*Click here for definition of petroleum products.

The graph above shows we’re importing a lot more oil from Canada and significantly less from states like Saudi Arabia, Mexico and Venezuela. The decreases in Saudi Arabia/Venezuela are probably political decisions to wean ourselves off of Middle East oil/regimes we don’t want to support financially. Mexican oil production has decreased due to depletion of fields and or lack of exploration by its oil companies. The one surprise on here might be the increase in purchases from Russia and Columbia, two countries who’ve picked up some of the slack from our declines elsewhere.

EOG’s Horizontal Wells in the Greater Green River Basin

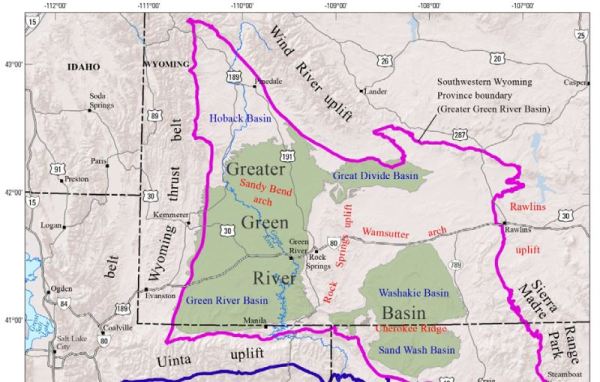
I’ve had a bit of a posting hiatus but I plan to continue to keep this blog updated, I’ve just been busy. This post will focus on production results from 27 horizontal wells drilled by EOG Resources (EOG) in the Greater Green River Basin (see map below) in Southwestern Wyoming. These wells were drilled between 2006 and 2010 and produce from the Frontier interval which is a natural gas zone. For reference, the Frontier interval is a similar but older age rock than the Lance interval which is the productive zone at the Pinedale and Jonah fields in the Greater Green River Basin.

Map of the Greater Green River Basin
USGS_Green-River-Basin
Source: USGS.

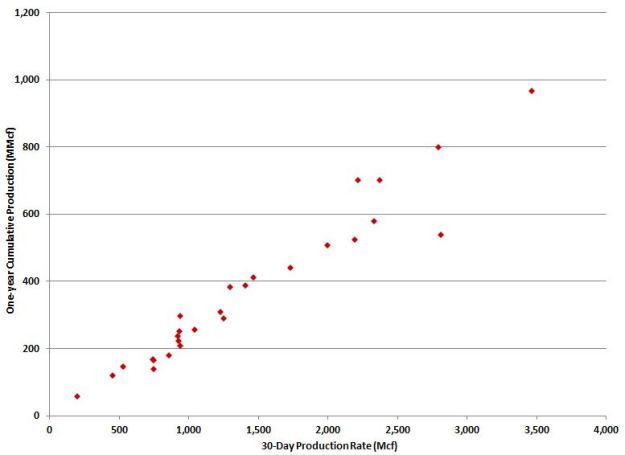
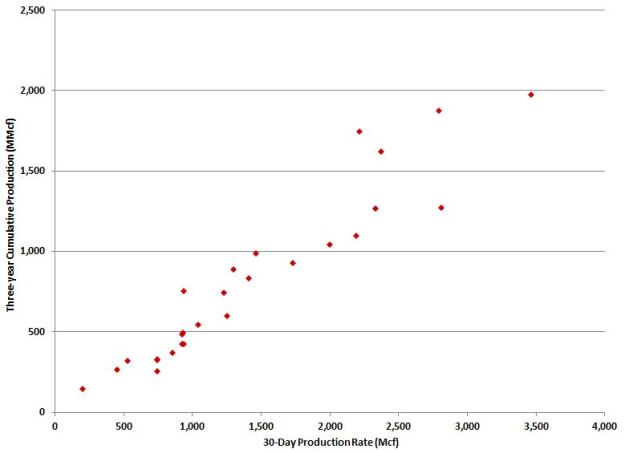
The average 30-day production rate from these wells is 1,430 thousand cubic feet of natural gas per day (Mcfpd) which corresponds to an average recovery of 369 million cubic feet of natural gas (MMcf) after one-year of production and 813 MMcf after three-years of production. Regarding the 27-wells, range of recoveries is wide with a maximum three-year recovery of 2.0 billion cubic feet of natural gas (Bcf) and a minimum of 145 MMcf.

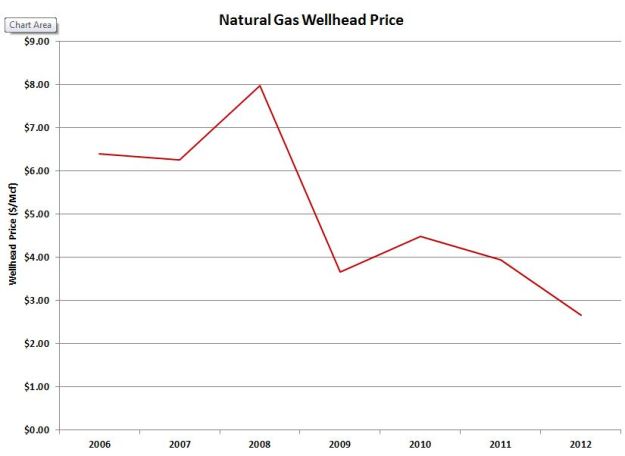
So how economic were these wells? I haven’t been able to find any information regarding cost, but what I can do is take a look at natural gas prices from 2006 forward to ballpark what these wells have grossed to date.

Annual Natural Gas Wellhead Prices (2006-2012)
Natural gas-wellhead-prices
Source: EIA.

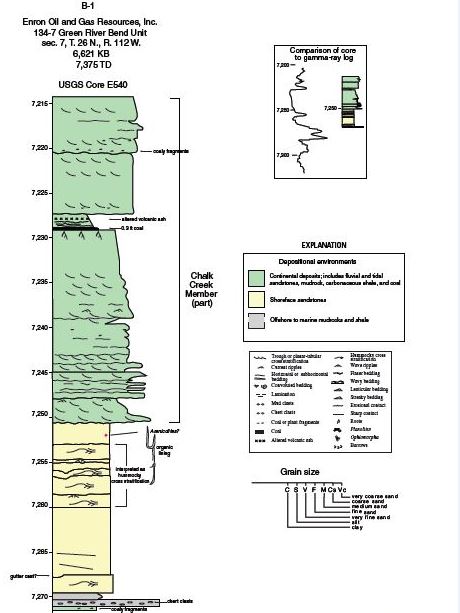
If we use $5.45 per Mcf (average price from 2006 to 2011) as the average price received per Mcf of natural gas and 813 MMcf as the average three-year recovery, we can see that these wells grossed an average of $4.4 million during their first three years of production. Without knowing well cost, we’re kind of left hanging here, but I do have a log (shown below) from an EOG well drilled in the Green River Bend field which shows depths in the 7,000′ to 8,000′ range.  Based on this, I’d assume they were each drilled and completed for approximately $5 to $6 million.

Green River Bend Well Log
EOG_Green-River-Basin-Well-Log
Source: USGS.

So what’s the payback period looking like? Assuming an 85% NRI and $5.5 million well cost, I’d guess these wells would need to produce approximately 1.2 Bcf per well with approximately 3 thousand barrels of oil to break-even. These wells only declined 30% from year one to year three, so they project to have a long production life. Knowing the above, I’d guess the payback period for 2006 to 2009 generation GRB Frontier wells is five to six years or triple the length of the average Bakken well drilled today.

With that said, the purpose of this write-up is to provide data on a pure natural gas play, something I haven’t done much of on this blog to date. Even though oil is currently more economic than natural gas, natural gas is going to play a larger role in fueling the world moving forward so it makes sense to familiarize ourselves with the potential of some of these formations.

Last, I thought I’d toss in a couple scatter plots on the wells used in this analysis. As shown below, it’s pretty easy to tell how economic a natural gas well in this field will be based on the 30-day production rate.

Green River Basin Production (Frontier Zone) Year 1
EOG-Green-River-Basin-Production-Graph-Year-One

Source: Wyoming Oil and Gas Conservation Commission/The Energy Harbinger.

Green River Basin Production (Frontier Zone) Year 3
EOG-Green-River-Basin-Production-Graph-Year-Three
Source: Wyoming Oil and Gas Conservation Commission/The Energy Harbinger.

The Bakken’s Stacked Pay Zones

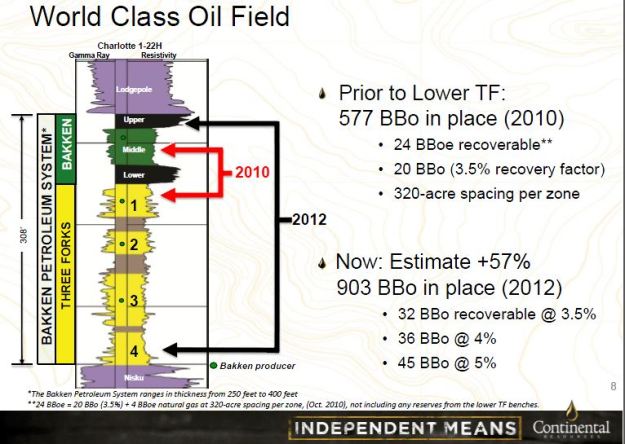
Continental Resources (CLR) came out with data last winter indicating that at least some of its acreage in the Bakken would be prospective for stacked pay zones. The evidence it provided was results from its Charlotte Unit wells in McKenzie County where the company was producing from three zones, the Middle Bakken, Three Forks 2 and Three Forks 3 (see stratigraphic column below).

Continental_Bakken-Three-Forks-Stratigraphic-Column
Source: Continental Resources Corporate Presentation

As you can see from the picture above, the company’s success in the Three Forks increased its oil in place estimates for the Bakken Petroleum System to 903 billion barrels of oil (BBO) from 507 BBO and recoverable reserves to 32 BBO at a 3.5% recovery factor. CLR has a lot of work to do to prove this assertion and it will be delineating its acreage for multiple Three Forks zone potential.

Producing from the Three Forks is nothing new in the Bakken, but what’s interesting is that CLR is producing from multiple Three Forks (TF) benches which may prove the potential of multiple reservoirs in the Bakken thus more reserves than what has been produced in the Middle Bakken.

I don’t have CLR’s well data organized well enough to show you the results of its TF wells.  Part of the problem is having to dig through well files which are large documents that take a long time to open on North Dakota’s Oil and Gas Division website.  Luckily, some companies give us clues that a well is a Three Forks well by putting “TFH” or Three Forks Horizontal in the well title.

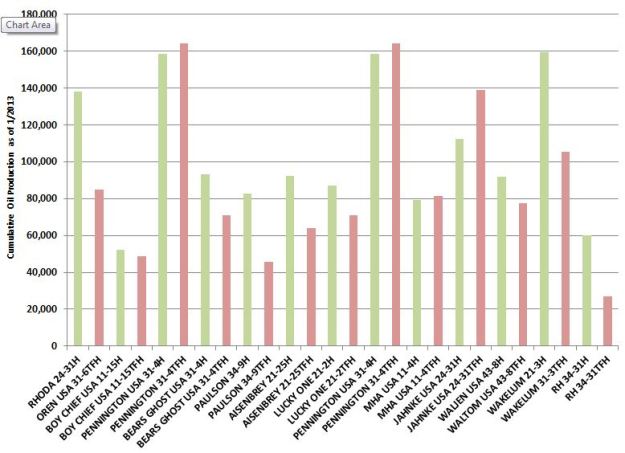
Marathon Oil (MRO) is one of these companies and I have data from 26 of its wells across Mountrail and Dunn Counties, half of which targeted the Bakken and the other half Three Forks. These wells were drilled very close to each other in pairs indicating that the company believes each section is economic for both the Bakken and Three Forks.

Note: When I say the wells were drilled very close, I’m saying same quarter section at minimum with parallel lateral legs.

Cumulative production from Stacked Pay Zones
Marathon Oil_Bakken-Three-Forks-Cumulative-Production
Source: North Dakota Oil and Gas Division / The Energy Harbinger.

I’ve color coded all of the above Bakken wells in green and TF wells in red.  The first two wells, Rhoda 24-31H and Oren USA 31-6 TFH, are a pair of wells which were both drilled very close to each other but in different zones.  What needs to be determined to prove that the Bakken and the Three Forks are separate reservoirs is that the cumulative production will not be effected by the drilling of either well, that is that one well is not draining oil from the other thus resulting in you drilling two wells for the price one.

All of these wells were drilled during 2011 and 2012 and the quick and dirty average cumulative production from them is 97 thousand barrels of oil (MBO) and I usually use 150 MBO as a target for payback from a Bakken well.  This would indicate that these wells are paying back in two to four years which is a solid result and compares well with the company’s historical production in the Bakken.

There’s a lot more to talk about and analyze with regards to this topic and the implications could be large.  For instance, if I have 100 Bakken well locations in my inventory but find out the Three Forks zone is productive in all of those same areas, I now have 200 well locations.  All of the above wells were drilled in clusters across both Dunn and Mountrail County, meaning Marathon either doesn’t think most of its acreage is prospective for multiple zones, it’s capital has been tied up in the Eagle Ford where returns are better or it’s not following the same naming system with all of its TF wells.

I will be looking into the above for MRO as well as where other companies are drilling TFH wells in the Bakken.  When I have more data on CLR, MRO, etc I’ll be writing another article.