I felt it was time to get some macro data on this site which provides perspective for some of the “hot-button” words heard in the news media like “energy independence.” The data below compares oil and petroleum product imports during 2002 and a decade later during 2012. The U.S. imported 3.9 billion barrels of oil* (BBO) (10.6 MMBOPD) during 2012 or 8% less than the 4.2 BBO (11.5 MMBOPD) it imported in 2002.
We also used less oil in 2012 as consumption dropped 6% to 6.8 BBO (18.5 MMBOPD) compared to 7.2 BBO (19.8 MMBOPD) in 2002. Imports as a percent of total consumption have dropped from 58% in 2002 to 57% in 2012, meaning we’re not importing significantly less petroleum contrary to what many would hope as domestic production increases.
*When I refer to oil in the above paragraph, the figure includes petroleum products (see below for definition).
Let’s answer the next natural question here, how much did domestic oil production really increased during the decade in consideration? In this section we’re going to look at just crude oil which would be distinct from petroleum products.
U.S. Crude Oil Production (2002 to 2012)

Source: EIA.
Domestic crude oil production increased 14% to 2.4 BBO (6.5 MMBOPD) in 2012 from 2.1 BBO (5.7 MMBOPD) in 2002. This of course doesn’t tell the full story as crude production was tanking circa 2008 before shale production ramped up and changed the course of our energy history. I’d have to imagine there would be a lot more support for the Keystone XL pipeline if U.S. oil shale hadn’t been exploited.
If you’re wondering about exports, we shipped approximately 22 MMBO (60 MBOPD) across borders during 2012, 564% more than 3.3 MMBO (9 MBOPD) in 2002 and 49% less than 43 MMBO (118 MBOPD) in 1999. While exports increased quite a bit over the time studied, 22 MMBO is a spit in the proverbial bucket.
All in all, it doesn’t seem like we’re a whole lot closer to energy independence than we we’re during 2002 as even domestic production hasn’t increased that drastically when you look at the period as a whole. With that said, when most people think about energy independence, they’re probably throwing Canada into the mix which makes the concept slightly more feasible while also putting our energy fate in the hands of heavy crude, a dirty proposition.
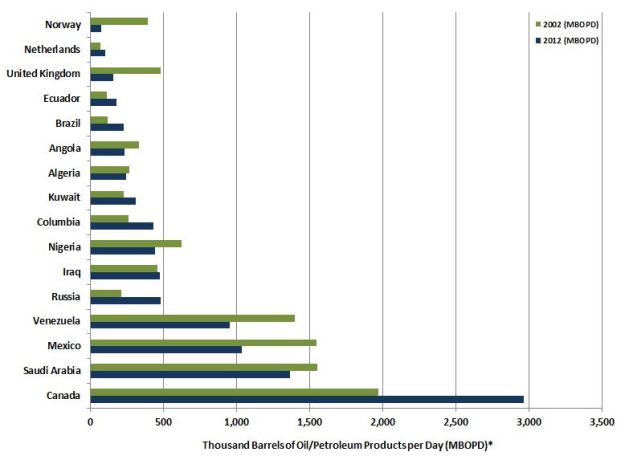
U.S. Imports of Oil and Petroleum Products by Country (2002 and 2012)

Source: EIA
*Click here for definition of petroleum products.
The graph above shows we’re importing a lot more oil from Canada and significantly less from states like Saudi Arabia, Mexico and Venezuela. The decreases in Saudi Arabia/Venezuela are probably political decisions to wean ourselves off of Middle East oil/regimes we don’t want to support financially. Mexican oil production has decreased due to depletion of fields and or lack of exploration by its oil companies. The one surprise on here might be the increase in purchases from Russia and Columbia, two countries who’ve picked up some of the slack from our declines elsewhere.
