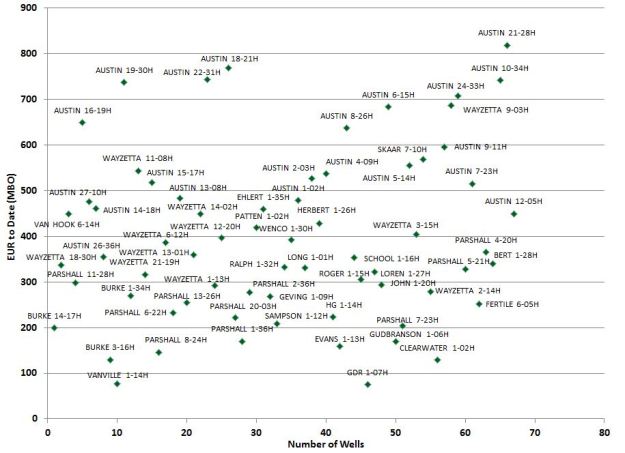
This analysis looks at data from 92 of EOG’s Bakken wells which turned to production between January 1, 2006 and January 1, 2009. The goal of this piece is to start to understand how much hydrocarbons Bakken wells will eventually produce. Most of these wells were drilled in the Parshall Field which is located in Mountrail County and are some of the better wells the Bakken has produced. The scatter-plot below shows the spread of estimated ultimate recoveries (EUR) from some of EOG’s longer life wells.
Scatter Plot of EOG’s Older Bakken Wells

Source: North Dakota Oil and Gas Division / The Energy Harbinger.
Note: Some wells used in this analysis were left off so the graph would be legible.
The scatter-plot above shows most of the wells EOG has drilled have recovered between 200 and 400 thousand barrels of oil (MBO) to date. The company has drilled very few poor wells with strong EURs overall.
The average 30-day production rate from these wells is 1,081 BO and 465 thousand cubic feet (Mcf) of natural gas or 1,158 barrels of oil equivalent (BOE/93% oil). The average EUR (to date) is 384 MBO and 176 MMCF of natural gas or 414 MBOE (93% oil). From this we can draw the conclusion that a well which produces in the 1,000 BOE range during its first 30 days will recover approximately 400 MBOE during its first four to five years of production. What does this mean from a return standpoint?
If we assume an 82% net royalty interest (NRI) and a price deck of $80 oil and $3 natural gas, the company has earned $26 million from its average well drilled in the Bakken with 98% of the revenue coming from oil during the time-span studied. Drilling and completion costs for these wells were most likely in the $6 to $9 million range, meaning they’ve returned several times their initial cost. While this data might not be a direct comparable to other areas of the Bakken, it gives you an idea of the returns which can be expected from the upper-echelon Bakken acreage.
There’s plenty more research to be done on my end with respect to IP rates/EURs in the Bakken and in other formations which will show readers the returns they can expect on wells drilled. So for instance once The Well Map is a little more dynamic, you’ll be able to infer EURs from the 30-day rates I’ve provided on the map. I do expect to add more complete production information to the wells in the future.

Branden,
Interesting chart for EOG well, if I understand correctly.
Here is what I think I see. You have taken well production data, entered each well data into an EUR estimate curve fit and plotted that EUR against the production life of the well in months (to date).
Is this correct?
If this is correct, I make two conclusions:
1) The newer wells, on average, are not as strong as older (or could this be the early curve fits are under estimating EUR)?
2) There is a very wide range of well performance even within the strong Parshalls field.
It is interesting that you included the well names. For example, does the “Austin” on most of the strongest wells suggest that this is a relatively small strong spot? Is this just on square mile lease holding?
Thanks Dave O
I will throw one more question at you, because it is a recurring theme where ever I look investigate shale oil companies…
How does EOG always make the best wells? Their company performance backs this fact, along with the well data available.
Does this match your observations?
Thanks
Dave,
I have complete production data for each of the wells on this graph so the points on the scatter plot represent the actual production of each well. The horizontal axis which I just labeled represents the number of wells in the analysis. While you’re correct in assessing that EOG’s more recent wells are weaker, the point of this article was to show the EURs of their longer life wells. Their more recent wells have produced less off the bat, but who knows maybe the declines will be more gradual. There is a wide range of well results and I would suppose the Austin wells are close together and that is probably one of the “sweet spots” of the Bakken.
As for EOG, I think their geologists have done a great job in not only identifying the best areas of the plays they get into but they identify them faster than the geologists of other companies.
If you look at both well cost and results, they’re the best in the business.
If I didn’t answer anything sufficiently, let me know.